The Darwin Challenge Multipliers
Each of the 10 metrics in the Apple version have a ‘multiplier’ at their heart. For example, for every meat-free day, you save 0.00031 of a cow. That 0.00031 is the ‘multiplier’. So after 7,630 meat-free days we have saved a whole cow. Below we explain how we calculated those multipliers.
These are the multipliers per meat-free day.
Extra Lifespan: 46.15 minute
Money Saved: $US 0.96
Hungry people fed: 0.037 of a person.
Cows still mooing: 0.00013 of a cow
Chickens still clucking: 0.064 of a chicken
Fish still splashing: 1.04 aquatic of an species
Forest: 4.91 m2 saved (capped at a year)
Greenhouse gases avoided: 1.63 kg CO2 equiv. for meat production. 322 kg CO2 equiv. for habitat destruction as a result of meat production, (capped at a year)
Water still flowing: 98 toilet flushes
Marine Reserve created: 11.7 m2 (capped at a year)
(Note: At the moment we are not able to change the coding of the Apple version to change the above metrics)
We are always working hard to deliver the most accurate data, but it is only fair to mention that we are more confident with some metrics than others. At the end of each metric, we give a confidence rating out of 10. As we develop the app and do more research, those confidence ratings will improve.
+ Multiplier 1: Extra lifespan
Expert: Dr Peter Sainsbury MBBS, PhD (Adjunct Professor at Sydney Medical School & University of Notre Dame. Adjunct Associate Professor at School of Public Health, University of Sydney. Past President, Public Health Association of Australia.)
Compared to someone who eats 100 grams of processed red meats per day, someone who does not eat any processed red meat should extend their life by 46.15 minutes per meat-free day. After 32 meat-free days you should live a whole day longer.
Critical Fact 1.1 (CF 1.1)
Average years of subjects at the beginning of the studies.
Answer: 60 years
i
CF 1.2
How much longer should an average Swede live after 60? Life expectancy of 65 year old Swedes in 2004.
=65 + 18.4
ii
= 83.4
Answer: 23.4 years, 8548.02 days
CF 1.3
Additional days of life for people who currently eat no processed red meat compared with those currently eating 100gm per day of processed red meat.
Answer: 9 month, which equals 9 x 365.3/12 = 273.98 days
iii
CF 1.4
Additional minutes of life for people who don’t eat any processed red meat compared to those who currently eat 100gm per day of processed red meat.
= 274/8548.02
= 0.03205 of a day
=(24x60) x 0.03205
Answer: 46.15 minutes
Confidence in result: 5/10
Note 1: 100gm of processed meat per day is a lot.
Note 2: How long had the non-processed red meat eaters been eating no meat?
+ Multiplier 2: Money saved
Note: The below calculations need to be updated to include new research that has come to light
Approximately US$ 0.93 of extra money per meat-free day. So if you have one meat-free day for a year, you are $340 richer, nice.
Critical Fact 2.1 (CF 2.1)
According to the Oxford University & UK Heart Foundation study, a diet where 29% of calories are sourced from meat, fish and dairy (the normal UK diet) costs around £23.16 per person per week. A diet where only 6% of calories is from meat, fish and diet costs £17.93, saving you £5.23 ($11.10) per week or £0.75 per day or $US 0.93 per day (using a con £/US$ conversion rate of 0.8). If you are in a family of four that has two meat-free day per week, you will save £312 per year (US$ 378) for a family of four
iv
.
Answer: $US 0.93 extra money per meat-free day.
Confidence in result: 5/10
Note 1: This needs more research because the above study still had some meat in the diet so the amount will probably be more than $US 0.93.
Note 2: The above study is a single study, we would prefer to find a meta-study.
+ Multiplier 3: Hungry people fed
The hungry people of the world are in direct competition with chicken for the world’s grain. Because a vegetarian diet uses less cereals, per meat-free day, you reduce global cereal prices a miniscule amount but approximately enough to raise 0.03677 of a person out of chronic malnutrition. It is extraordinary to think that after just 13 meat-free days, you have reduced the global price of cereals enough to raise one person out of chronic malnutrition.
Critical Fact 3.1 (CF 3.1)
How many people are living with malnutrition?
Answer: 793 million
v
CF 3.2 & 3.3
What is the relationship between global cereal prices and the number of people with chronic malnutrition?
Since there is enough food in the world to feed everyone, why are there any people suffering from chronic malnutrition? There are many reason for chronic malnutrition war, politics, disease but the most common reason is that those people do not quite have enough money to buy enough food. Consequently there is a correlation between food prices and malnutrition. As food prices increase so do the number of people with chronic malnutrition and visa versa.
Here are some examples of when cereal prices increase, the number with malnutrition also increase.
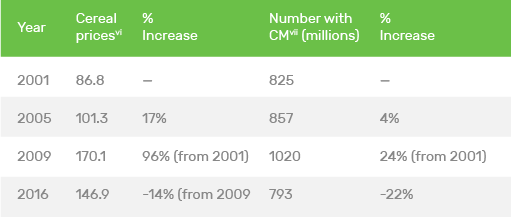
Answer: This data (and other data) confirm the correlation between global cereal prices and the number with chronic malnutrition.
CF 3.4
How much less grain does a vegetarian use than the average OECD consumer.
Answer: 1.41430 kg/cap/day (Assuming a 1:1 substitution of vegetable protein with animal protein)
To see the calculations download the Excel spreadsheet, page ‘3 Malnutrition’, cell E31
CF 3.5
How much would one person having one meat-free day reduction global demand for cereals? Assuming we reduce demand by 1.41kg per day (CF 3.4) Global cereal production forecast in 2016/17 is 2,599.8 million tonnes
viii
Answer: 1.98E-10 To see the calculations download the Excel spreadsheet, page ‘3 Malnutrition’, cell E41
CF 3.6
How many starving people would one meat-free day effectively bring out of chronic malnutrition?
Assuming that the distribution of people with malnutrition is linear. In CF 3.3 we saw how increases and decreases of global cereal prices impacts the number of people with chronic malnutrition. Assuming the most conservative of those changes, the 2001 to 2005 increase of 16.7% in cereal prices, that contributed to the 3.9% increase in the number with chronic malnutrition.
= CF 3.5 x 3.9/16.7
= 4.6E-11
Multiplied by the number of people with CM 793 million
Answer: 0.03677.
So for every meat-free day, you bring down global cereal prices enough so that 0.0367 of a person can afford to feed themselves enough to be no longer classified as being in chronic malnutrition.
To see the calculations download the Excel spreadsheet, page ‘3 Malnutrition’, cell D51.
Confidence in result: 2/10
Note 1: We need an agricultural economist who can give us modelling of how global cereal prices respond to increases and decreases in global demand.
+ Multiplier 4: Cows still mooing
Every day you don’t eat an OECD diet of meat you save approximately 0.0001311 of a cow. So each OECD member eats about 4 cattle in their lifetime.
Critical Fact (CF) 4.1
How much meat does the average cow produce? A 1,000lbs steer produces 430 lbs of retail cuts (a steer is a neutered bull) = 195kg. So it yields 43% to meat.
ix
Cow tend to be heavier, 1500lb
x
, which is 680kg, so assuming the 43% conversion rate, would produce 292.4kg of meat.
Answer: 292.4kg of meat
CF 4.2
How much beef does the average member of the OECD eat per day? OECD figures for 2014 indicate that the average person eats 14kg/cap/year of beef
xi
. This works out to 0.0383kg per day.
Answer: 0.0383kg per day
To determine how much of a cow you eat each day if you eat average OECD amount of beef:
= CF 4.2/CF 4.1
= 0.0383/292.4
Answer =0.0001311
So every day you don’t eat an OECD diet you save 0.0001310 of a cow.
Confidence in result: 7/10
Note 1: This is worked out using a cow’s weight, we really need to get an average weight of all cattle and use that figure.
+ Multiplier 5: Chickens still clucking
Every day you don’t eat an OECD diet of meat you save approximately 0.064 of a chicken. The average person in the OECD eats 23 chickens per year.
Critical Fact (CF) 5.1
How much meat does the average chicken produce? Gutted and plucked weight of chicken 1.9kg
xii
. Approximately 62% of chicken is meat so 1.178 kg of meat
xiii
.
CF 5.2
How much chicken does the average member of the OECD eat per day? In the OECD for 2014 the average person eats 27.53kg/cap/year of chicken xiv . This works out to 0.0754 kg per day.
To determine how much of a chicken you eat each day if you eat average OECD amount of chicken:
= CF 5.2/CF 5.1
= 0.0754/1.178
Answer: 0.064
So every day you don’t eat an OECD diet you save 0.064 of a chicken.
Confidence in result: 7/10
Note 1: Some of these are not high quality references, it would be good to get some others.
Note 2: We are assuming that these figures are table weight, not pre-table weight.
Note 3: 75 grams per day seems like a lot, it would be good to get a second reference for this figure.
+ Multiplier 6: Fish still splashing
Every day you don’t eat an OECD diet of meat you save approximately 1.043 fish/prawns per day. The average meat eater in an OECD country eats 30,000 aquatic organisms (fish, crustaceans, shellfish, etc) in their lives.
Critical Fact (CF) 6.1
Total weight of aquatic species caught or farmed in 2012.
Answer: 158 million tonnes live weight xv .
CF 6.2
Total number of aquatic species caught or farmed: 970-2,700 billion fish caught in the wild, 37-120 billion farmed fish, 170-over 400 billion farmed decapod crustaceans.
Answer: 2198.5 billion aquatic organisms xvi .
CF 6.3
How much does the average aquatic organism caught or farmed weigh?
= CF 6.1/CF 6.1
= 158 billion kg/2,198.5 billion individuals seafood
Answer: 0.0719 kg per individual aquatic organism.
CF 6.4
How much marine and freshwater species does the average member of an industrialised country eat per day?
Total amount of aquatic organism eaten in industrialized countries is 27.4kg/cap/year. xvii (note this is not OECD) So the average person eats 0.075kg per day (live weight)
CF 6.5
So if someone is eating 0.075kg, how many individual species are they eating per day:
= CF 6.4 / CF 6.3 = 0.075kg / 0.0719 kg = 1.043 fish/crustaceans/others per day
Confidence in result: 4/10
Note 1: We need to check which figures are live weight and which figures are gutted, descaled, de-shelled and deboned weight.
Note 2: The number of organisms caught is a range and we have taken the medium figure. We need to see if there are better estimates. Note 3: This is not clear if this data includes shellfish and bi-catch. A lot of bi-catch is used as feed in fish farms.
+ Multiplier 7: Forest saved
Note: The below calculations need to be updated to include new research that has come to light
According to Global Forest Watch, our world’s forests and woodlands are being felled at a rate of 0.68 ha per second (2014 figure - 21.5m ha), which means that every second an area of forest or woodland the size of an international soccer pitch is being destroyed xviii . We are destroying the world’s lungs. Global oxygen levels are dropping. 74% of this destruction is directly or indirectly for the livestock industry. Every meat-free day you have, you slightly reduce global demand for habitat destruction so you effectively save approximately 4.69 m2 of forest and woodland from being destroyed. If you have one meat-free day per week, after a year, you have save an area of forest and woodland the size of a tennis court. Congratulations.
Critical Fact (CF) 7.1
What is the OECD consumption of different types of meat in per capita per day?
Beef: 0.038kg/cap/day
Pork: 0.060kg/cap/day
Chicken: 0.075kg/cap/day
Lamb: 0.0037kg/cap/day
Reference for above data
xix
CF 7.2
What are the ecological footprint factors (EFF) per kilo per day for various different types of meats and vegetables?
To see the calculations download the Excel spreadsheet, page ‘7 Forest’, cells G26 – G29. Reference for all EFF xx .
CF 7.3
Using the footprint factors, what is the area of land required to produce the OECD amounts of meats, and then replacing that animal protein with vegetable protein?
By multiplying the EFF by the OECD amount of different foods you get an area for the production of each different food types.
Answer: 4.69 m 2 To see the calculations download the Excel spreadsheet, page ‘7 Forest’, cell H35
Confidence in result: 8/10
Note 1: The rates of OECD meat consumption seem high, We would like to get a second reference for them to check whether they include waste.
Note 2: We need to insert the references for 74% of destruction by livestock industry stat.
+ Multiplier 8: Greenhouse - Car distance
Note: The below calculations need to be updated to include new research that has come to light
Most products create greenhouse gases in their production, use or disposal. Meats are no exception. Every meat-free day you have is the greenhouse equivalent of driving a car 5.64 km. If you and a friend have one meat-free day per week for a year, between the two of you, you save the equivalent amount of greenhouses as driving from London to Edinburgh.
Critical Fact (CF) 8.1
OECD meat consumption per capita per day
xxi
.
To see the calculations download the Excel spreadsheet, page ‘8 Greenhouse’, cell C6-C10
CF 8.2
What is the greenhouse gas ecological footprint from eating an average OECD meat consumption per day minus replacing that animal protein with vegetable protein?
Answer: 1.32 m2/capita/day.
Reference for ecological footprint factors (EFF) xxii .
To see the calculations go to the Excel spreadsheet ‘Metrics for app 3’, page ‘8 Greenhouse’, cell F15
CF 8.3
How far would you have to drive a car to produce that same amount of carbon dioxide? Assuming a fuel consumption of 8 litres per 100 km and an ecological footprint factor of petrol of 89
xxiii
.
Answer: 5.641 km.
To see the calculations download the Excel spreadsheet ‘Metrics for app 3’, page ‘8 Greenhouse’, cell G23
Confidence in result: 8/10
Note 1: These figures do not include the greenhouse gases given off by the destruction of forests and woodland.
+ Multiplier 9: Water in toilet flushes
Note: The below calculations need to be updated to include new research that has come to light
Supporting livestock takes a lot of water. Every meat-free day you have, you save the same amount of water as 98 flushes of the toilet. The average OECD citizen eating the average OECD amount of meat, requires 16 Olympic swimming pools of water to produce the meat that they will eat in their life.
Critical Fact (CF) 9.1
How much meat does the average OECD citizen eat
xxiv
?
To see the calculations download the Excel spreadsheet ‘Metrics for app 3’, page ‘9 Water’, column C.
CF 9.2
How much water is used to produce the OECD average meats, minus replacing that animal protein with vegetable protein
xxv
?
Answer: 589 litres/capita/day or 98 toilet flushes.
To see the calculations go to the Excel spreadsheet ‘Metrics for app 3’, page ‘9 Water’, cell I20.
Confidence in result: 7/10
Note 1: We need to adjust from ton to tonnes.
+ Multiplier 10: Marine reserve created
The world’s fishing fleets are having a big impact on global fish stocks. By not eating fish or seafood, you are reducing global demand and saving marine and freshwater species. Each meat-free day you have, you effectively create a 11.7m2 marine reserve. If you did not eat fish for 10 years, you would have effectively created a 4 hectare marine reserve. It is important to remember that many aquaculture species are fed with wild fish.
Critical Fact (CF) 10.1 What weight of aquatic organisms does the average OECD citizen eat on average per day.
Answer: 59 grams xxvi To see the calculations download the Excel spreadsheet, page ’10 Marine Reserve’, cell F10
C.F. 10.2 How much of the planet is required to ‘grow’ 59 grams of aquatic species xxvii .
Answer: 11.7 m 2 To see the calculations download the Excel spreadsheet ‘Metrics for app 3’, page ’10 Marine Reserve’, cell G10
Confidence in result: 8/10
Note 1: We need to think about the regenerative capacity of the aquatic species because at present that is not taken into account.
Note 2: 59 grams seems high for an OECD daily consumption rate, we wonder if wastage is included in this figure.
References
Bellavia, A et al, (2014) Differences in survival associated with processed with nonprocessed red meat consumption. US National Library of Medical Institute of Health. Available at WWW: https://www.ncbi.nlm.nih.gov/pubmed/25030780
DM, (2013), Dairy Moos Blog, How much do cows weigh? Aug 18, 2013, Available at WWW: http://www.dairymoos.com/how-much-do-cows-weight/
DAFF (2006), Land Use in Australia – At a Glance, Department of Agriculture and Water Resources, Available at WWW: http://www.daff.gov.au/abares/aclump/Documents/Land_use_in_Australia_at_a_glance_2006.pdf (cited 9th October 2015),
Eurostat (2017), Life Expectancy at age 65, by sex, Eurostat, Available at WWW: http://ec.europa.eu/eurostat/tgm/table.do?tab=table&init=1&language=en&pcode=tps00026&plugin=1 (cited 24th March 2017)
Faloon, W., (2006), Do Vegetarians Live Longer? Life Extension Magazine, Available on WWW:
http://www.lifeextension.com/magazine/2006/1/awsi/Page-01 (cited 9th Sept 2015)
FAO (2014-1), The State of the World Fisheries and Aquaculture 2014. Food and Agricultural Organisation of the United Nations. Available on WWW: http://www.fao.org/about/meetings/icn2/toolkit/hunger-facts/en/ Total fish harvest: p4, Total per cap of industrialized countries: p62
FAO (2014-2), ICN2 Second International Conference on Nutrition. Food and Agricultural Organisation of the United Nations. Available on WWW: http://www.fao.org/3/a-i3720e.pdf
FAO (2017 - 1), FAO Food Price Index, Food and Agricultural Organisation of the United Nations. Available on WWW: http://www.fao.org/worldfoodsituation/foodpricesindex/en/
FAO (2017 - 2), World Food Situation, Food and Agricultural Organisation of the United Nations. Available on WWW: http://www.fao.org/worldfoodsituation/csdb/en/
FC (2014), Fish Count Estimates, Fish Count, Available at WWW: http://fishcount.org.uk/fish-count-estimates
GF (2017) Green Fields, Football Pitch Dimensions, Available at WWW: http://www.greenfields.eu/football-pitch-dimensions/ (cited 20th May 2017). Note: FIFA say that for official matches the dimensions of a football pitch can range between 100m x 64m (0.64 ha) up to 110m x 75m (0.825 ha)
GFN (2008-2017), Global Footprint Network, Private correspondence with the Global Footprint Network to use their footprint factors from their year 2000 data.
GFW (2014), Global Forest Watch, Gross Tree Cover Loss in 2014, Available at WWW: http://www.globalforestwatch.org/countries/overview (cited 20th May 2017)
Hinzey, E., (2015), Seventh-Day Adventist Diet, Nutrition 411 (13th April 2015), Available on WWW:
http://www.nutrition411.com/articles/seventh-day-adventist-diet-0 (cited 9th Sept 2015)
HTH (2011), Chicken Math Blog, How much meat is in a whole chicken? Home to Homestead, Available at WWW: http://www.housetohomestead.com/2011/03/chicken-math-how-much-meat-is-in-a-whole-chicken/
News Medical, (2005), Meat eaters more likely to be obese than Vegetarians, News Medical, Life Sciences and Medicine 27th June 2005, Available on WWW: http://www.news-medical.net/news/2005/06/27/11299.aspx [cited 10th September 2015]
ODAFF (No date), How much Meat? Oklahoma Department of Agriculture, Food and Forestry, Available on WWW: https://www.oda.state.ok.us/food/fs-cowweight.pdf
OECD, (2014), How’s Life in the United States? The Organisation for Economic Cooperation and Development. Available at WWW: http://www.oecd.org/statistics/BLI%202014%20US%20country%20report.pdf longevity: p5
OECD, (2016), Meat Consumption, The Organisation for Economic Cooperation and Development. Available at WWW: OECD, (2014), How’s Life in the United States? The Organisation for Economic Cooperation and Development. Available at WWW: https://data.oecd.org/agroutput/meat-consumption.htm
PCRM (2014), Applying the Precautionary Principle to Nutrition and Cancer, Physicians Committee for Responsible Medicine, Available on WWW: http://www.pcrm.org/sites/default/files/pdfs/health/cancer/Dietary-guidelines-for-cancer-prevention.pdf [cited 7th September 2015]
Scarborough, P, et al (2010) Modelling the health impacts of the diets described in ‘Eating the Planet’ published by Friends of the Earth and Compassion in World Farming, British Heart Foundation Health Promotion Research Group and University of Oxford (Department of Public Health), 14th Oct 2010, Available on WWW: http://www.ndph.ox.ac.uk/bhfcpnp/about/publications-and-reports/group-reports/modelling-health-impacts.pdf [cited 10th September 2015]
Singh, P. et al, (2003) Does low meat consumption increase life expectancy in humans?, US National Library of Medicine, National Institute of Health, 2003 Sep;78 (3 Suppl) 526S-532S, Available at WWW:
http://www.ncbi.nlm.nih.gov/pubmed/12936945 (cited 10th Sept 2015)
VS (2011), Vital Signs 2011, Worldwatch Institute, Numbers with malnutrition: pp 92-95.
WFN (2014), Water Footprint Network. Water footprint of crop and animal products: a comparison, (referencing to Hoekstra, A.Y. (2014) Water for animal products: a blind spot in water policy, Environmental Research Letters, 9(9): 091003.) Available at WWW: http://waterfootprint.org/en/water-footprint/product-water-footprint/water-footprint-crop-and-animal-products/
WWF (2015), Living Blue Planet Report, WWF and Zoological Society of London. Available at WWW: http://assets.wwf.org.uk/downloads/living_blue_planet_report_2015.pdf (cited 21st September 2015)
[i] Bellavia et al (2014)
[ii] Eurostat (2017)
[iii] Bellavia et al (2014)
[iv] Scarborough et al (2010)
[v] FAO (2014)
[vi] FAO (2017-1)
[vii] FAO (2014)
[viii] FAO (2017 – 2)
[ix] ODAFF (no date)
[x] DM (2013)
[xi] OECD (2016)
[xii] HTH (2011)
[xiii] HTH (2011)
[xiv] OECD (2016)
[xv] FAO (2014-1)
[xvi] FC (2014)
[xvii] FAO (2014 – 2)
[xviii] GFW (2014)
[xix] OECD (2016)
[xx] GFN (2008-2017)
[xxi] OECD (2016)
[xxii] GFN (2008-2017)
[xxiii] GFN (2008-2017)
[xxiv] OECD (2016)
[xxv] WFN (2014) & GF (2017)
[xxvi] OECD (2016)
[xxvii] GFN (2008-2017